 Learning .NET memory management
Unmanaged memory is often leaked when you forget to write code to deallocate it; however this can also happen because references are retained to the managed object which is responsible for deallocating it.
In other words, unmanaged memory can be held on to by managed memory; so even when it looks like you have an unmanaged problem, it can instead be a problem with your managed code. Code profilers like ANTS Memory Profiler can help demonstrate these kinds of leaks by showing you the chains of references holding unmanaged data in memory. In the example below, the majority of the memory used by the instance of System.Drawing.Bitmap (in black) is unmanaged, so may appear as an unmanaged memory leak, but the Instance Retention Graph in ANTS Memory Profiler demonstrates that it is in fact held in memory by Mandelbrot.Form1, a managed object.
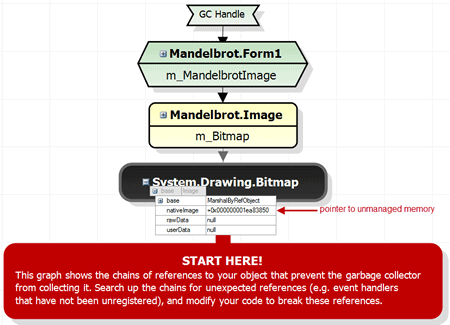
Quickly visualize why your leaking objects are still being held in memory with the Instance Retention Graph in ANTS Memory Profiler.
string is immutable, which can cause problems when you want to compose a large string from several elements. If you attempt this with simple string concatenation, you'll create a large number of small objects which must be garbage collected, using up lots of memory and putting unnecessary pressure on the GC. If you're constructing a string with a loop, you should use StringBuilderinstead of string concatenation.
Let's say you have the list ["a", "b", "c", "d", "e", "f"] and want to join the elements together to create "abcdef". Using string concatenation, a new string will be created on each iteration, whereas StringBuilderwill mutate the existing string. Instead of creating a new string "abc" on the third iteration, for example, it will append "c" to the value "ab". When you're working with large strings, the difference in performance and memory usage between creating a new string and modifying a StringBuildercan be significant.
List<T>A major appeal of List
private List<string> Tokenize (string data)
  {
    var returnValue = new List<string>();
    string[] tokens = data.Split(new char[] { ':' }).Select(func).ToList();
    foreach (string item in tokens)
    {
      returnValue.Add(func(item));
    }
  return returnValue;
}
This can introduce memory problems, however. List<T> is implemented using a simple array. When the backing array is full and you add new items, a new array double the size of the existing array is created. Consequently, if the Listisn't initialized with the required size, it might be resized several times, decreasing the performance and creating lots of intermediate arrays that will have to be garbage collected. The other implication is that a large array may actually use nearly twice as much memory as expected.
To avoid this, use the overloaded constructor for the Listwhich allows you to set an initial capacity and so reduce the number of resizing operations.
Value types are converted to reference types through a process known as boxing, and converted back into value types through unboxing. Boxing a value type creates a new reference type, then copies the value of the value type into the newly created reference type. This takes time and a little bit more than twice the memory of the original value type. Consequently, although boxing is sometimes necessary, it should generally be avoided, because it slows down performance and increases memory requirements.
Boxing can be avoided by using parameterized classes and methods, implemented using generics. Calls to the BoxedCallmethod will perform a boxing operation on value types and calls to the NonboxedCallmethod will not:
public void BoxedCall(object value)
{
 // Perform operation on value
}

public void NonboxedCall(T value)
{
 // Perform operation on value
}
Using generics, the type can be determined at compile time, which will improve code performance and prevent an object being boxed onto the heap that will have to be collected later.
Variables created outside of an anonymous method, but used within it, are captured in a closure. This allows the delegate to access the value even when the variable goes out of scope. The compiler does the heavy lifting here, creating a class and assigning values to it every time you use an outside variable. For example, once the compiler has worked on the closure in this example:
		public Person WhoReportsTo (List<Employee> data, Person targetEmployee)

		{
		 return data.Find(d => d.ReportsTo == targetEmployee);
		}
We end up with:
	[CompilerGenerated]

		private sealed class <>c__DisplayClass4
		{
		 // Fields

		 public Person targetEmployee;

		 // Methods

		 public bool <WhoReportsTo>b__3(Employee d)
		 {
		  return (d.ReportsTo == this.targetEmployee);
		 }
		}
The anonymous method is enclosed in a dynamic compiler-generated class, which includes a member variable for every external variable. This class, all the enclosed variables, and anything else that is referenced by it will stay alive as long as the delegate is accessible. This extended lifetime can keep objects in memory for far longer than they otherwise would be. Potentially, it can eat up a sizeable chunk of memory and create situations that look like a memory leak, so avoid closures with memory intensive variables.
A memory profiler will show you which code is holding onto your memory, and where you have memory leaks. A profiler will save you hours of time when it comes to pinpointing the code that contributes most to the memory problem. Here's a walkthrough that explains how to use ANTS Memory Profiler to track down memory leaks in a WinForms application. ANTS Memory Profiler also works with ASP.NET web applications, Windows services, Silverlight, and Sharepoint applications. With it, you can:
Learn more about ANTS Memory Profiler and help yourself to a free trial here.


